Since its first launch in September 2018, the Modern Medicaid Alliance’s Medicaid Dashboard has become an essential resource for federal and state leaders looking for up-to-date information on how many people are covered by Medicaid in each state and how each state’s Medicaid program is structured.

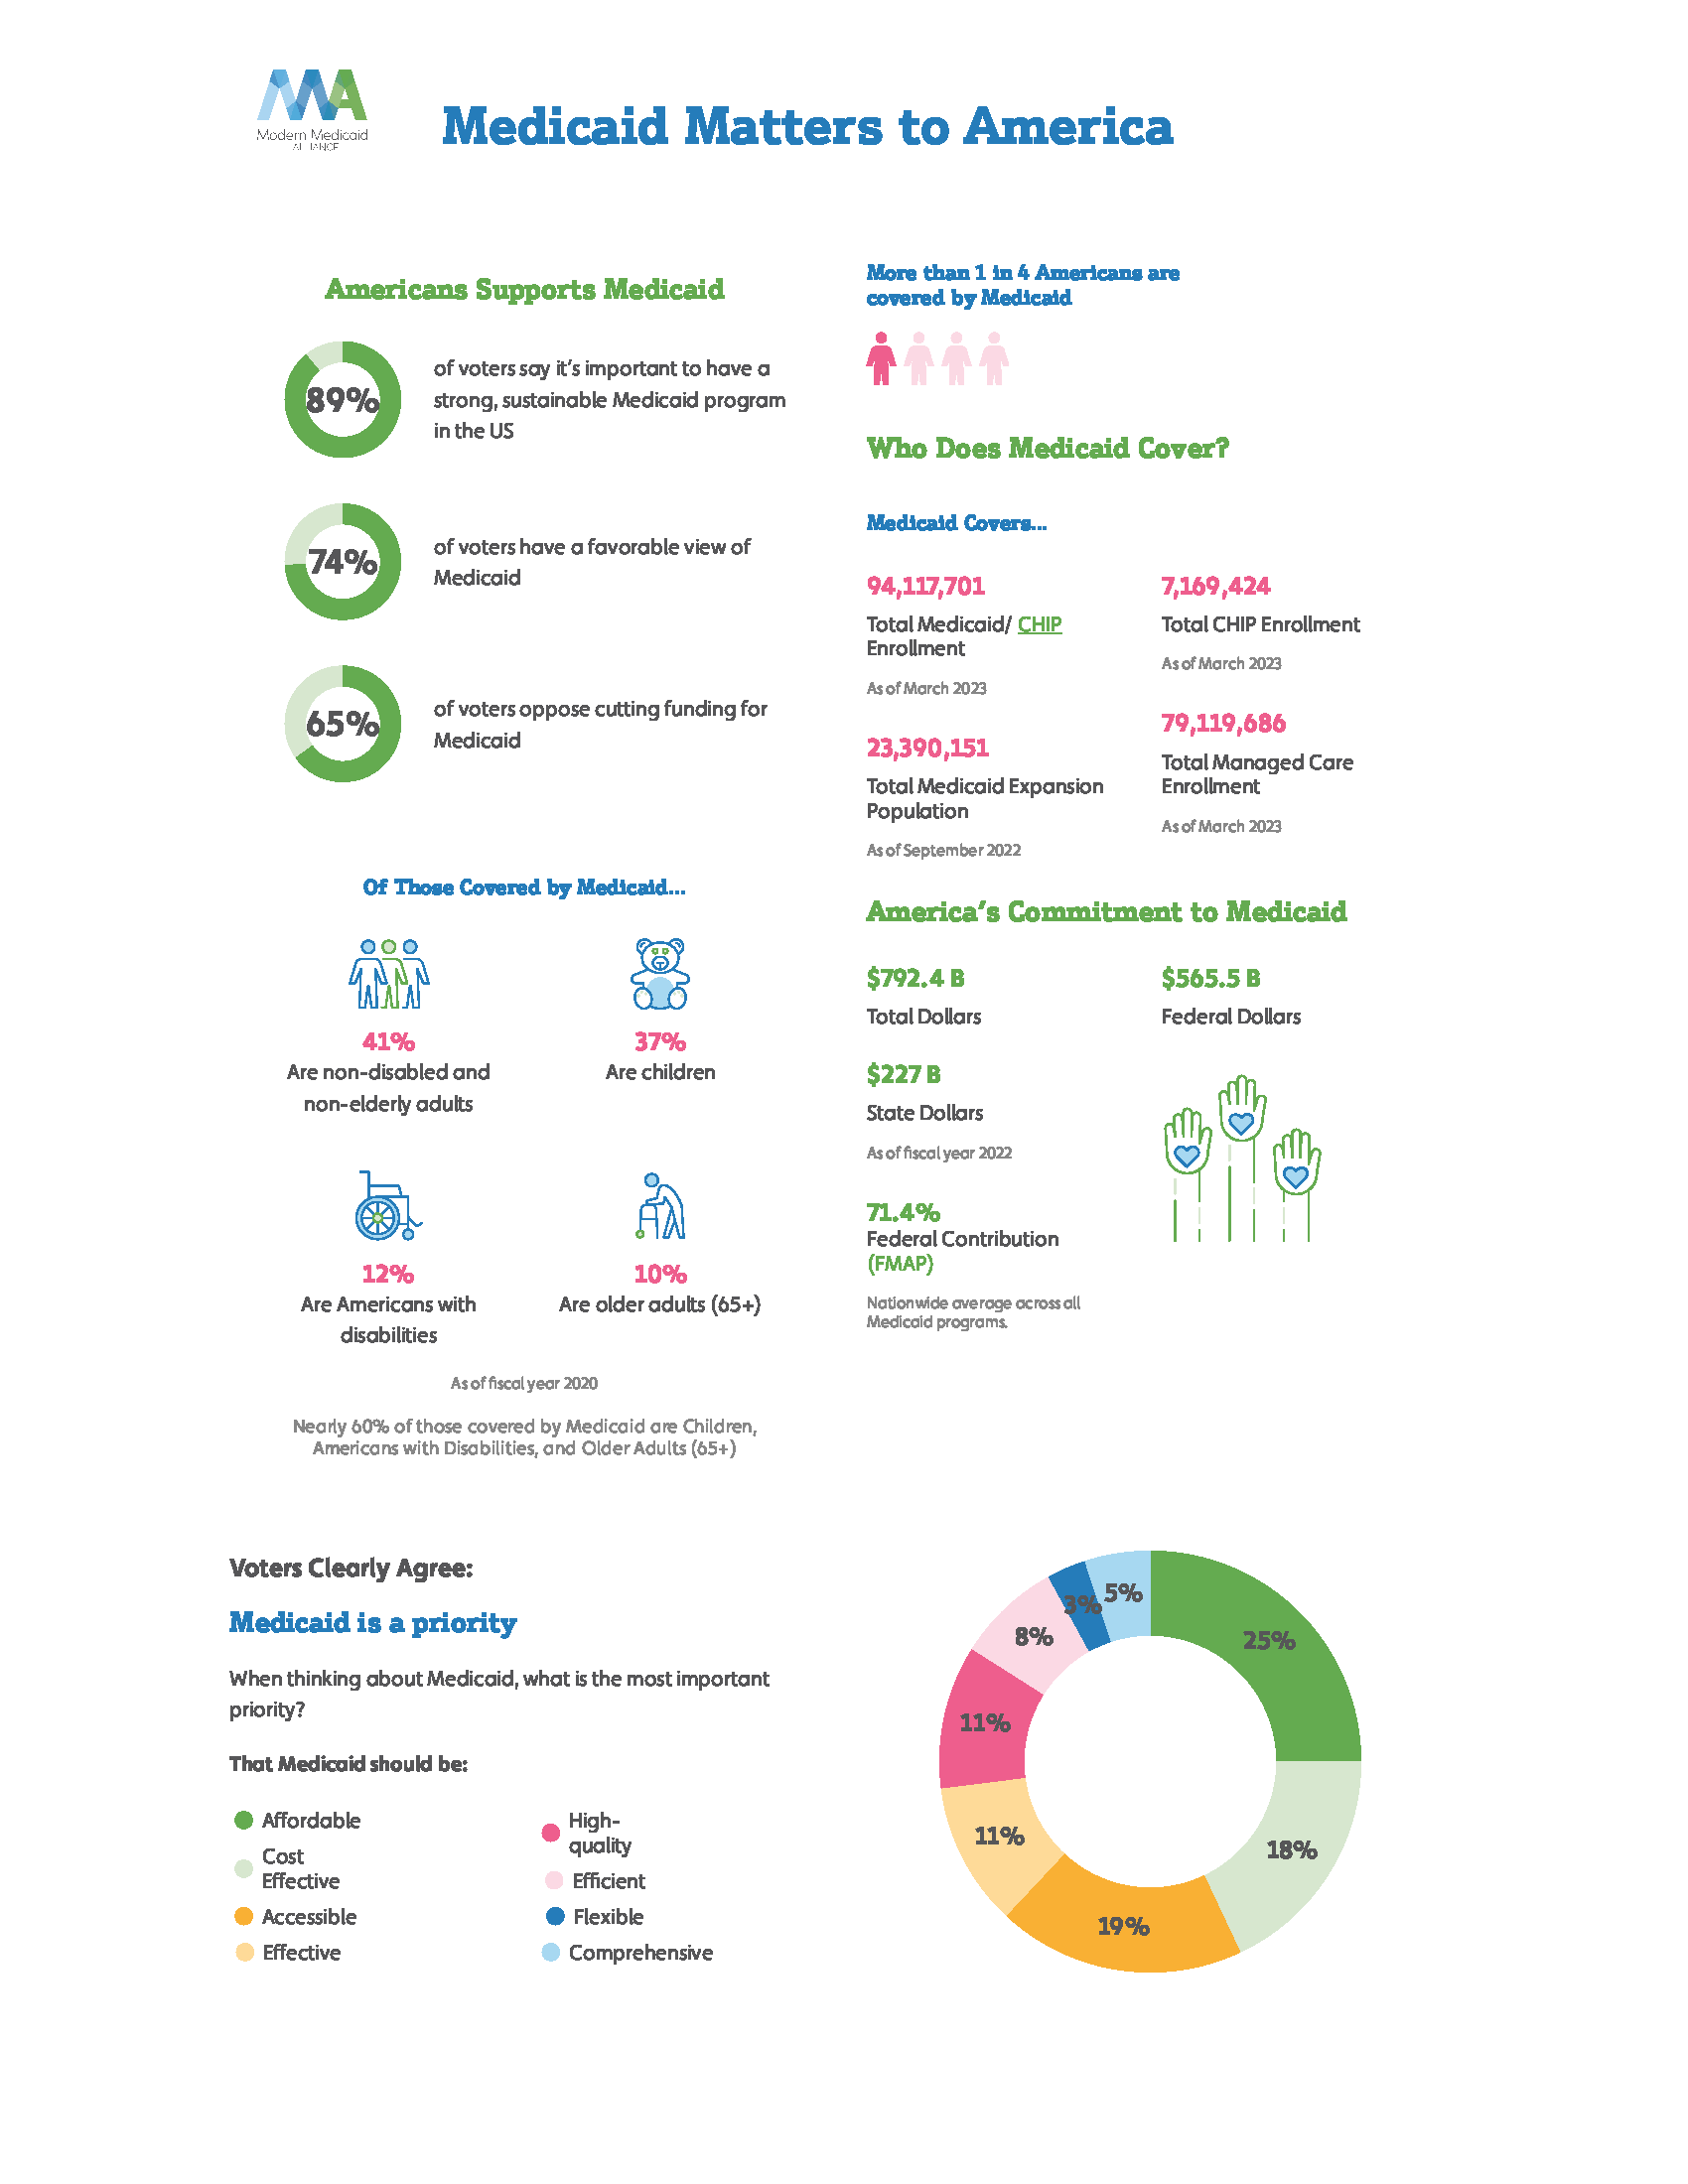
The newly updated Medicaid Dashboard highlights the latest, most comprehensive enrollment research, polling, and state-specific reports for all 50 states, plus the District of Columbia and Puerto Rico. A vast majority of voters (89%), say it’s important to have a strong, sustainable Medicaid program in the United States. The findings come at a critical moment as states continue the Medicaid redeterminations process to review whether Medicaid or CHIP enrollees are still eligible for the program following the end of the COVID-19 public health emergency.
Below are some recommendations on ways to use the Dashboard data in your organization’s daily activities:
- Demonstrate the overwhelming support for Medicaid through advocacy tools and educational resources. The Medicaid Dashboard provides polling data at the national level, and all 50 states plus the District of Columbia and Puerto Rico, demonstrating American voters’ positive opinions toward Medicaid. For example, 76% of voters in Michigan have a favorable view of Medicaid. We encourage partners to leverage these statistics in efforts to increase awareness of the broad support for the program or to advocate for strengthening Medicaid.

- Advocate for specific policy changes by sharing with state chapters to compare their Medicaid programs to neighboring states. Because Medicaid programs differ from state to state, organizations can use the Medicaid Dashboard to quickly compare one state’s program to another to help advocate for their desired policy changes. We encourage partners to use the state-specific pages and “download report” function to compare state Medicaid programs and help advance their goals in each state.

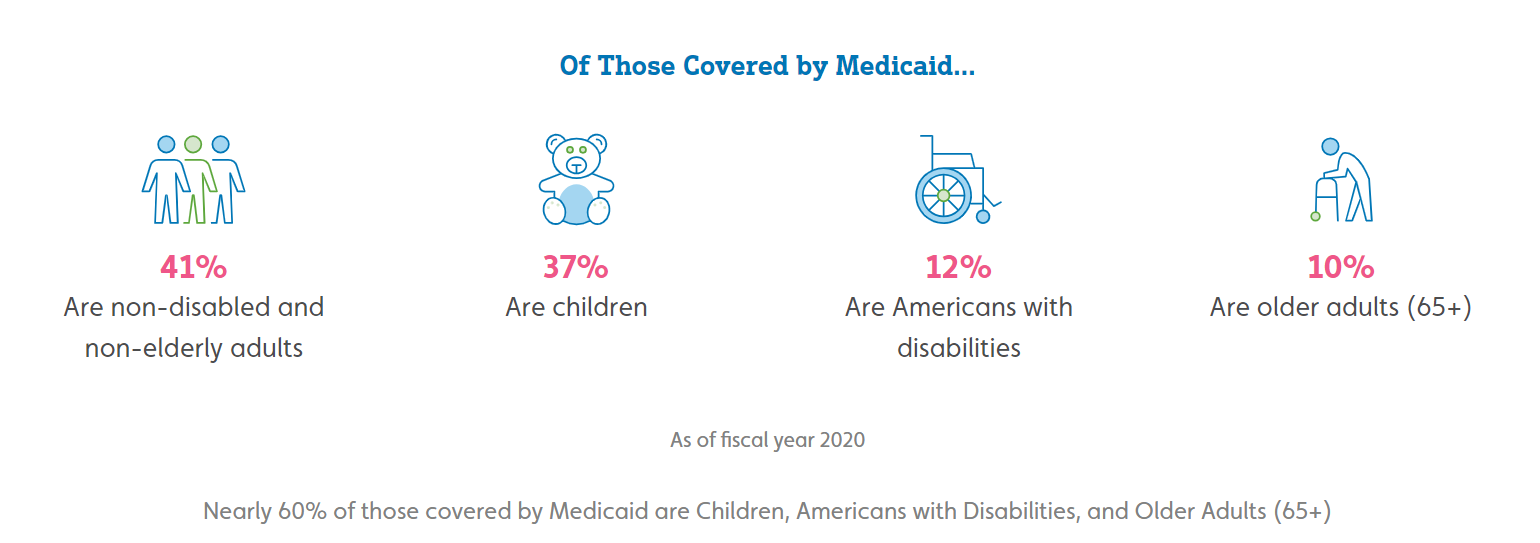
- Identify potential new partners based on population-specific data (e.g., children, people with disabilities, or older adults) provided by the Dashboard. The Dashboard includes breakdowns of the types of populations served by Medicaid at the national and state levels. For example, 37% of all those covered by Medicaid in the United States are children, or 12% of all those covered by Medicaid are people with disabilities. We encourage partners to use the Dashboard’s population-specific data to identify opportunities for partnership with other groups that advocate for or work closely with a given population.

Visit the Medicaid Dashboard at data.modernmedicaid.org and check out the Dashboard polling infographic today!